Investigating pollution hotspots in relation to road layout in Lewisham
Introduction
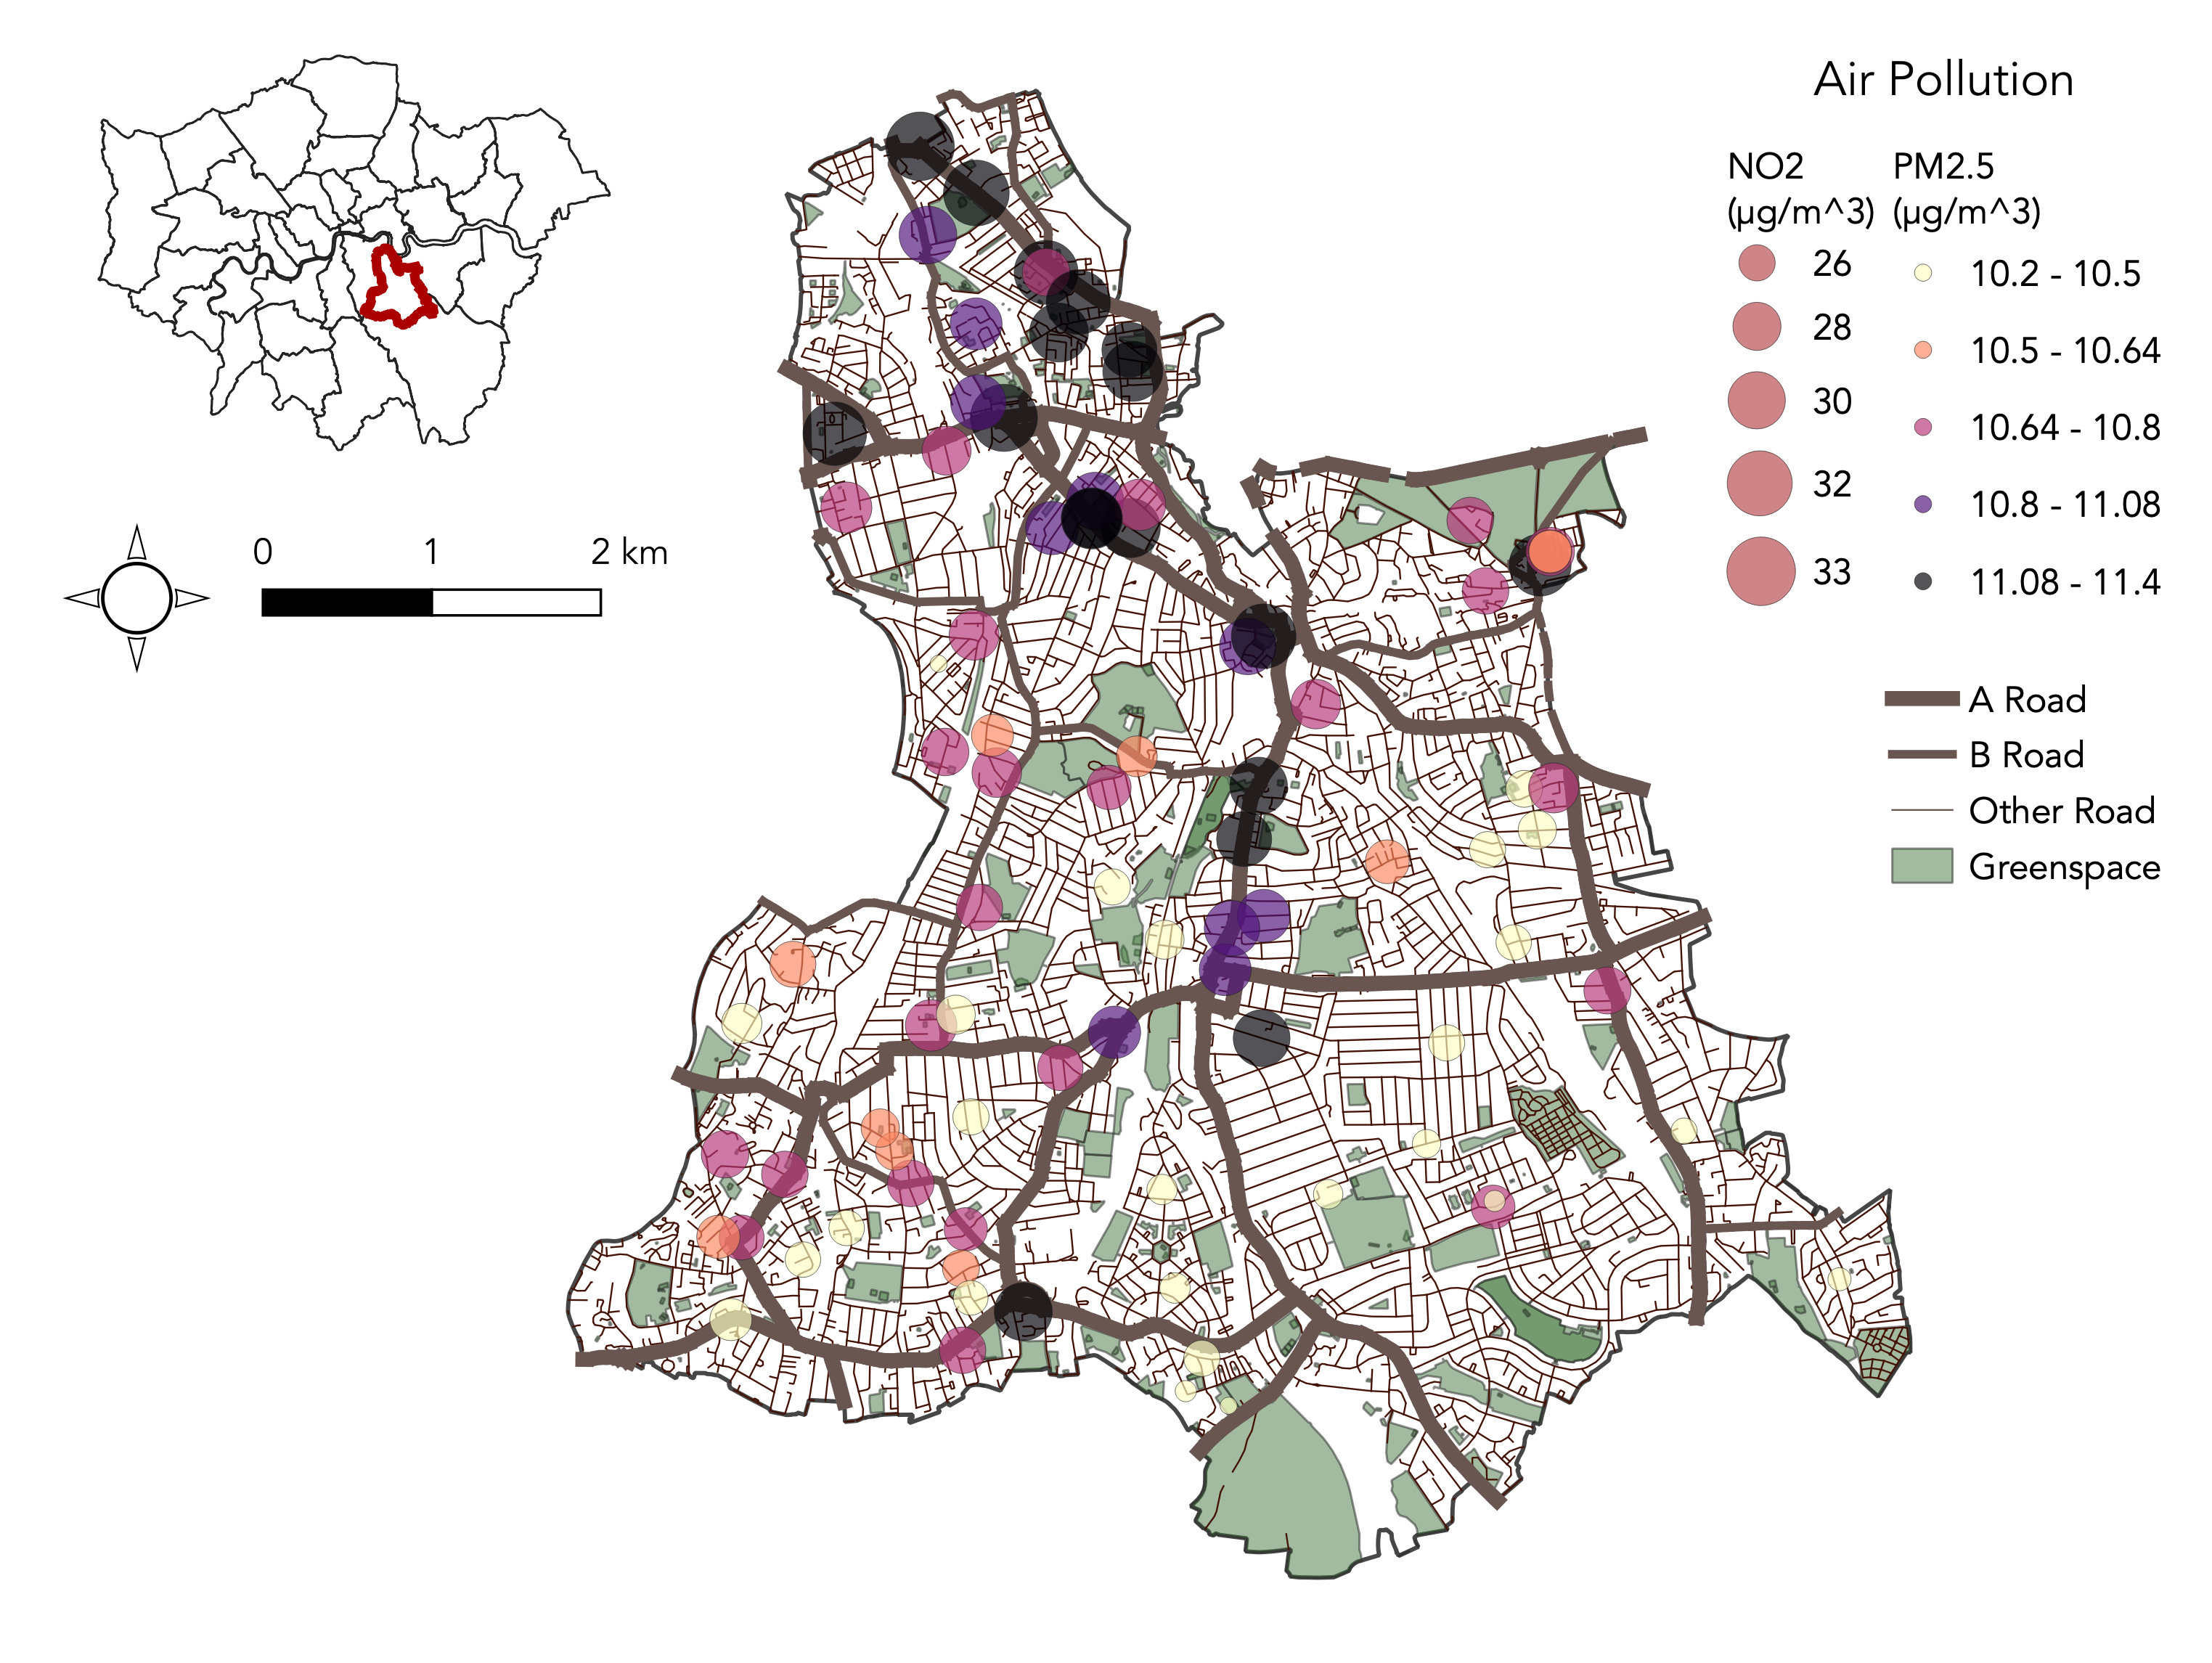
Continuing on the theme of air pollution in London, I wanted to map air pollution
against roads, anticipating that lower quality air readings might be found close to the
busiest roads and junctions.
Methodology
For the roads data, I used the OS Open Roads data source
(https://www.ordnancesurvey.co.uk/business-government/products/open-map-roads). Using
the Classification attribute,
I categorised the roads into A, B, and other minor roads.
I used the same source of air pollution data as I did in my Lewisham trees project, and
this time used rule-based labelling to represent both NO2 and PM2.5 readings on the map.
I decided to also include some greenspace data as I thought it might add something to
the final map (source: https://osdatahub.os.uk/downloads/open/OpenGreenspace).
Discussion
I think that the map shows a fairly strong correlation between more primary roads, and
poorer air quality. As discussed in the Lewisham trees project, the worst quality air
is closest to the centre of London, where the population density is highest, but the air
values in the middle of the map along the north-south A road (Lewisham Road), show
that air pollution can be affected by busy roads.
The study is limited by the fact that the air pollution data does not contain any information about what time of year or what time of day it was collected; some readings might have been taken at peak commuting times, and others in the middle of the day. Furthermore, the roads data does not actually tell us how busy a road is; this is inferred from the classification of the road.
The study is limited by the fact that the air pollution data does not contain any information about what time of year or what time of day it was collected; some readings might have been taken at peak commuting times, and others in the middle of the day. Furthermore, the roads data does not actually tell us how busy a road is; this is inferred from the classification of the road.