How might rising sea levels affect the Isles of Scilly?
Introduction
Rising sea levels are a widely-known consequence of the climate crisis and the potential
impact is often demonstrated by showing famous and populous places, such as London or
Amsterdam, having areas underwater due to different levels of sea rises.
I wanted to take this idea and apply it to a lesser-known place which will likely
experience very damaging effects due to rising seas: the Isles of Scilly.
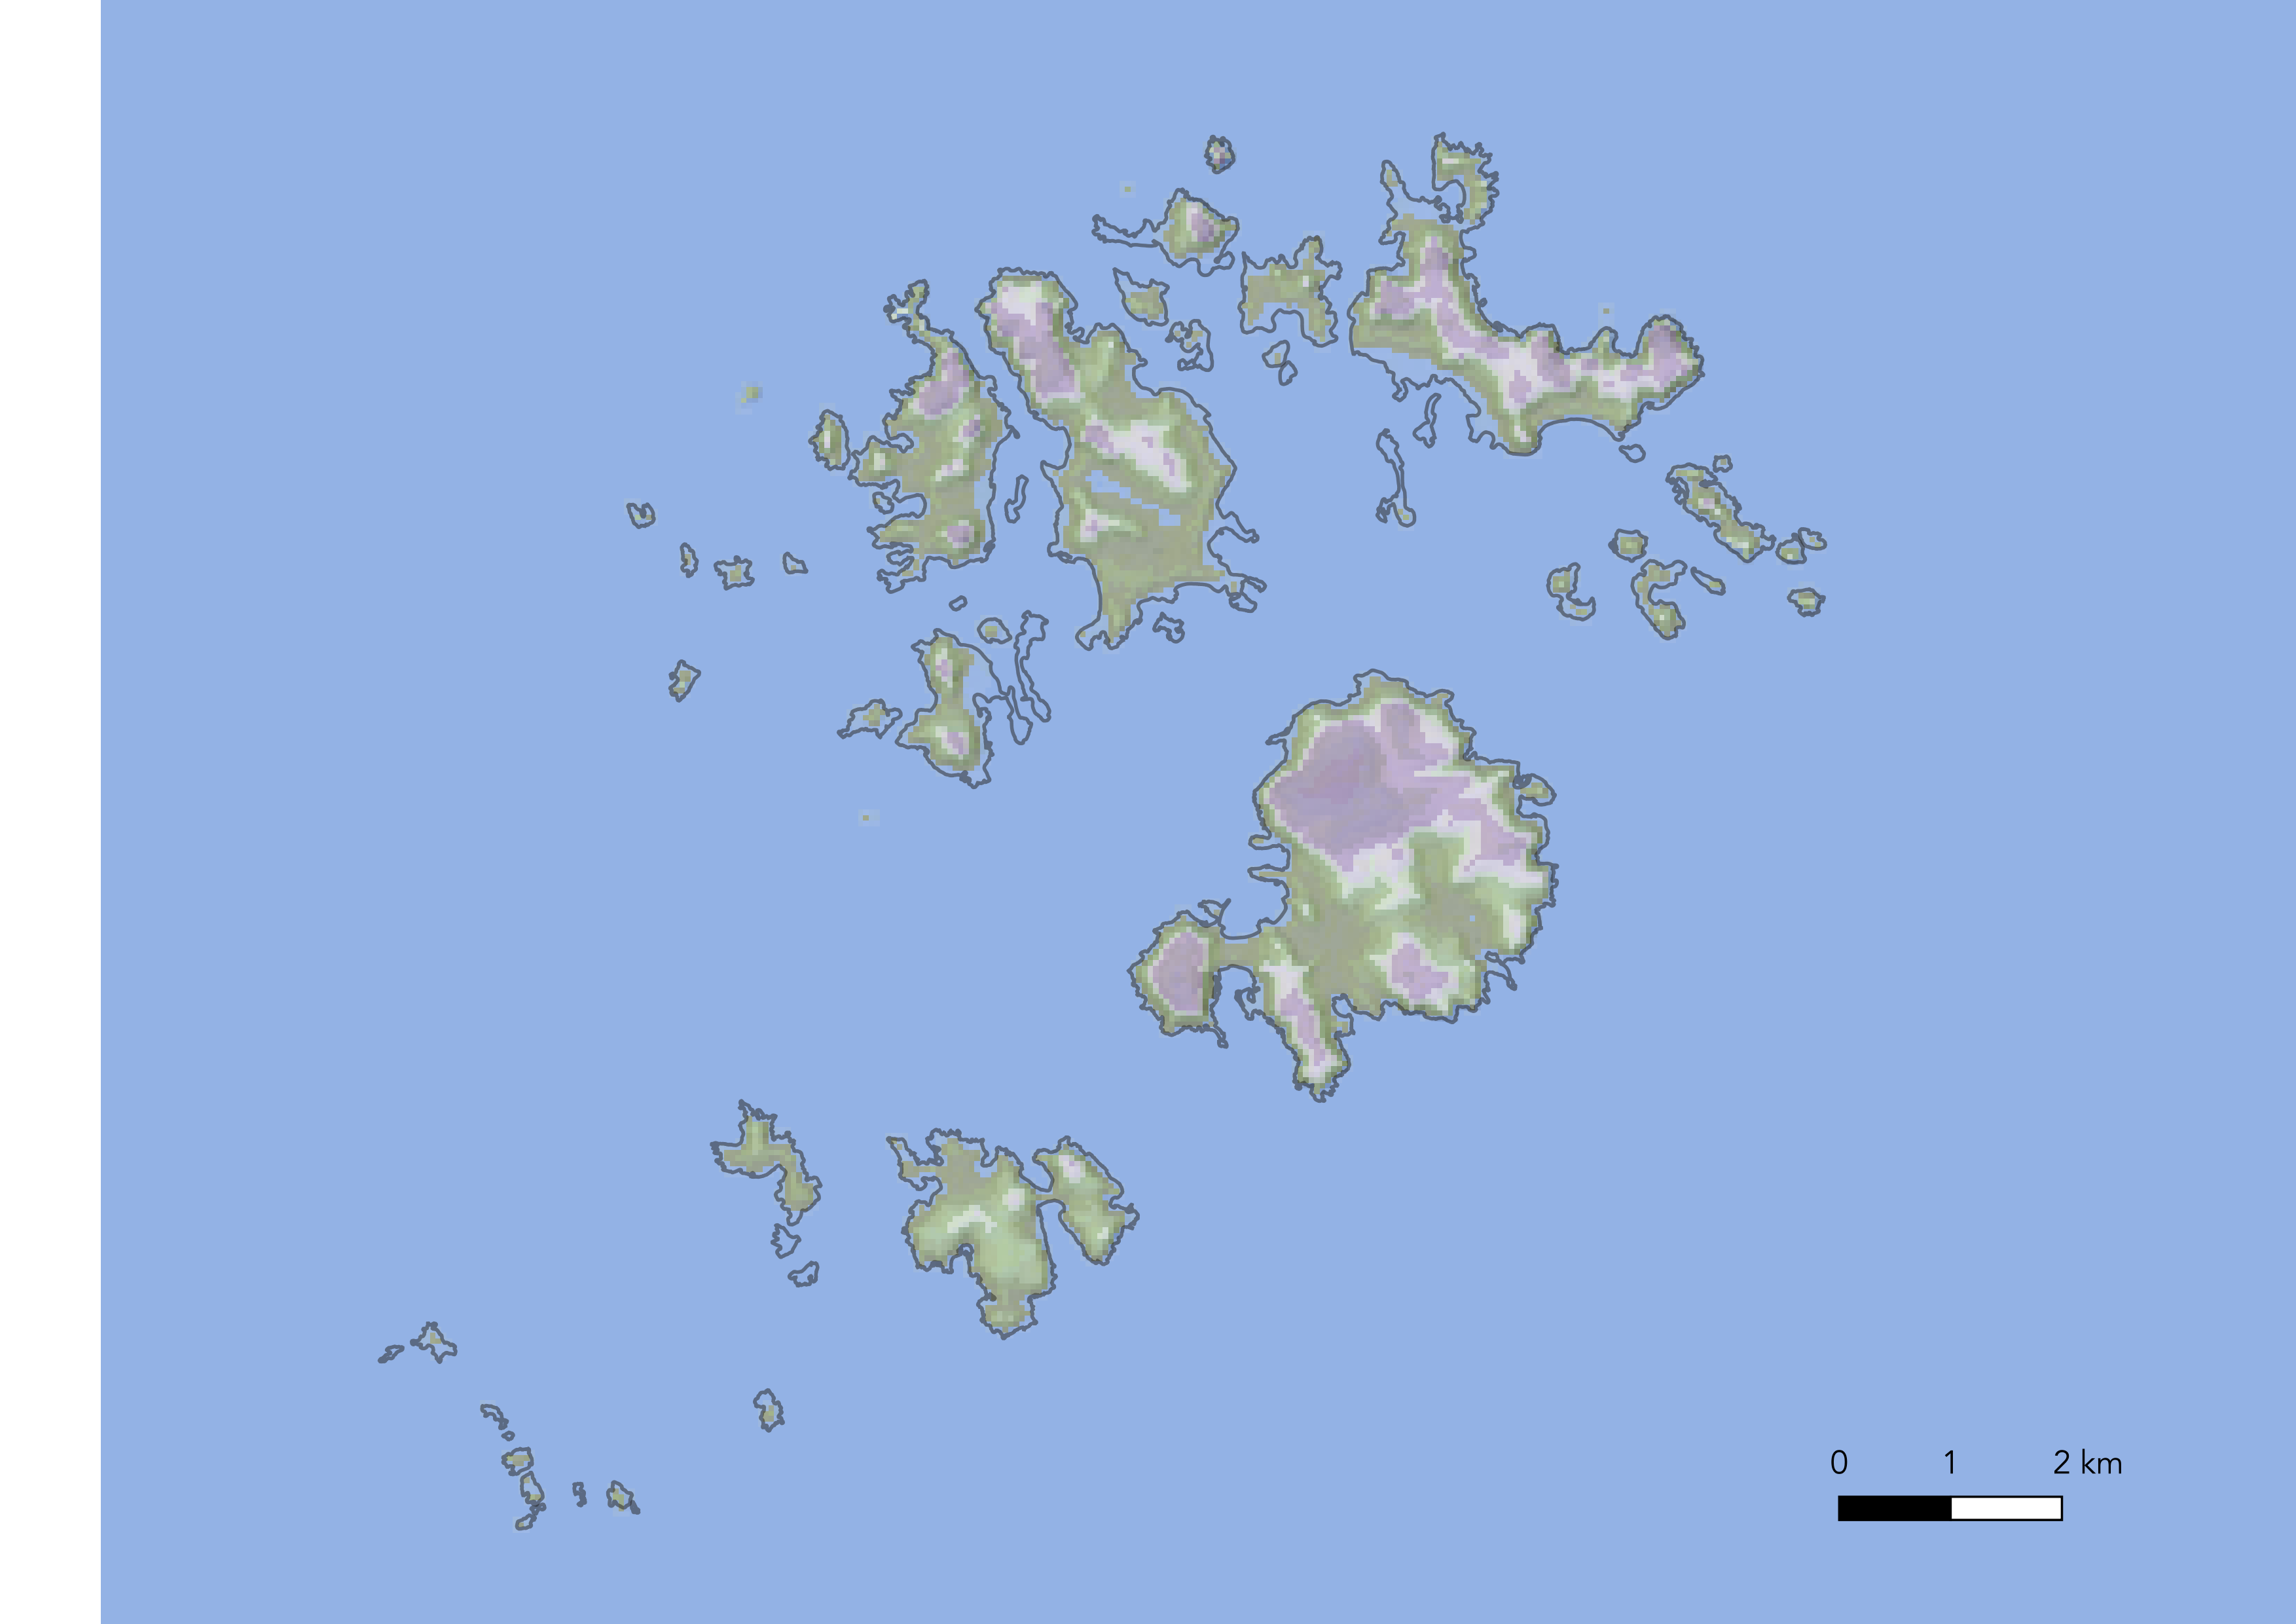
The archipelago off the south west coast of Cornwall is somewhat of a hidden gem; there are beautiful beaches and a quaint atmosphere, and the with highest average temperature of anywhere in the UK, there is an abundance of flowers and succulents which are hard to find elsewhere in the country. However, much of this may be at risk if sea levels rise at rates predicted by some scientific models. In the following maps I have shown an estimate of how the island group might be affected by different levels of rising.
This project was completed in QGIS.